LatentDiscovery.
Comparing clustering philosophies — K-Means, GMM, and HDBSCAN — on a 28-dimensional financial dataset projected into 3D latent space via UMAP to isolate fraudulent transaction topologies.
Clustering Dashboard
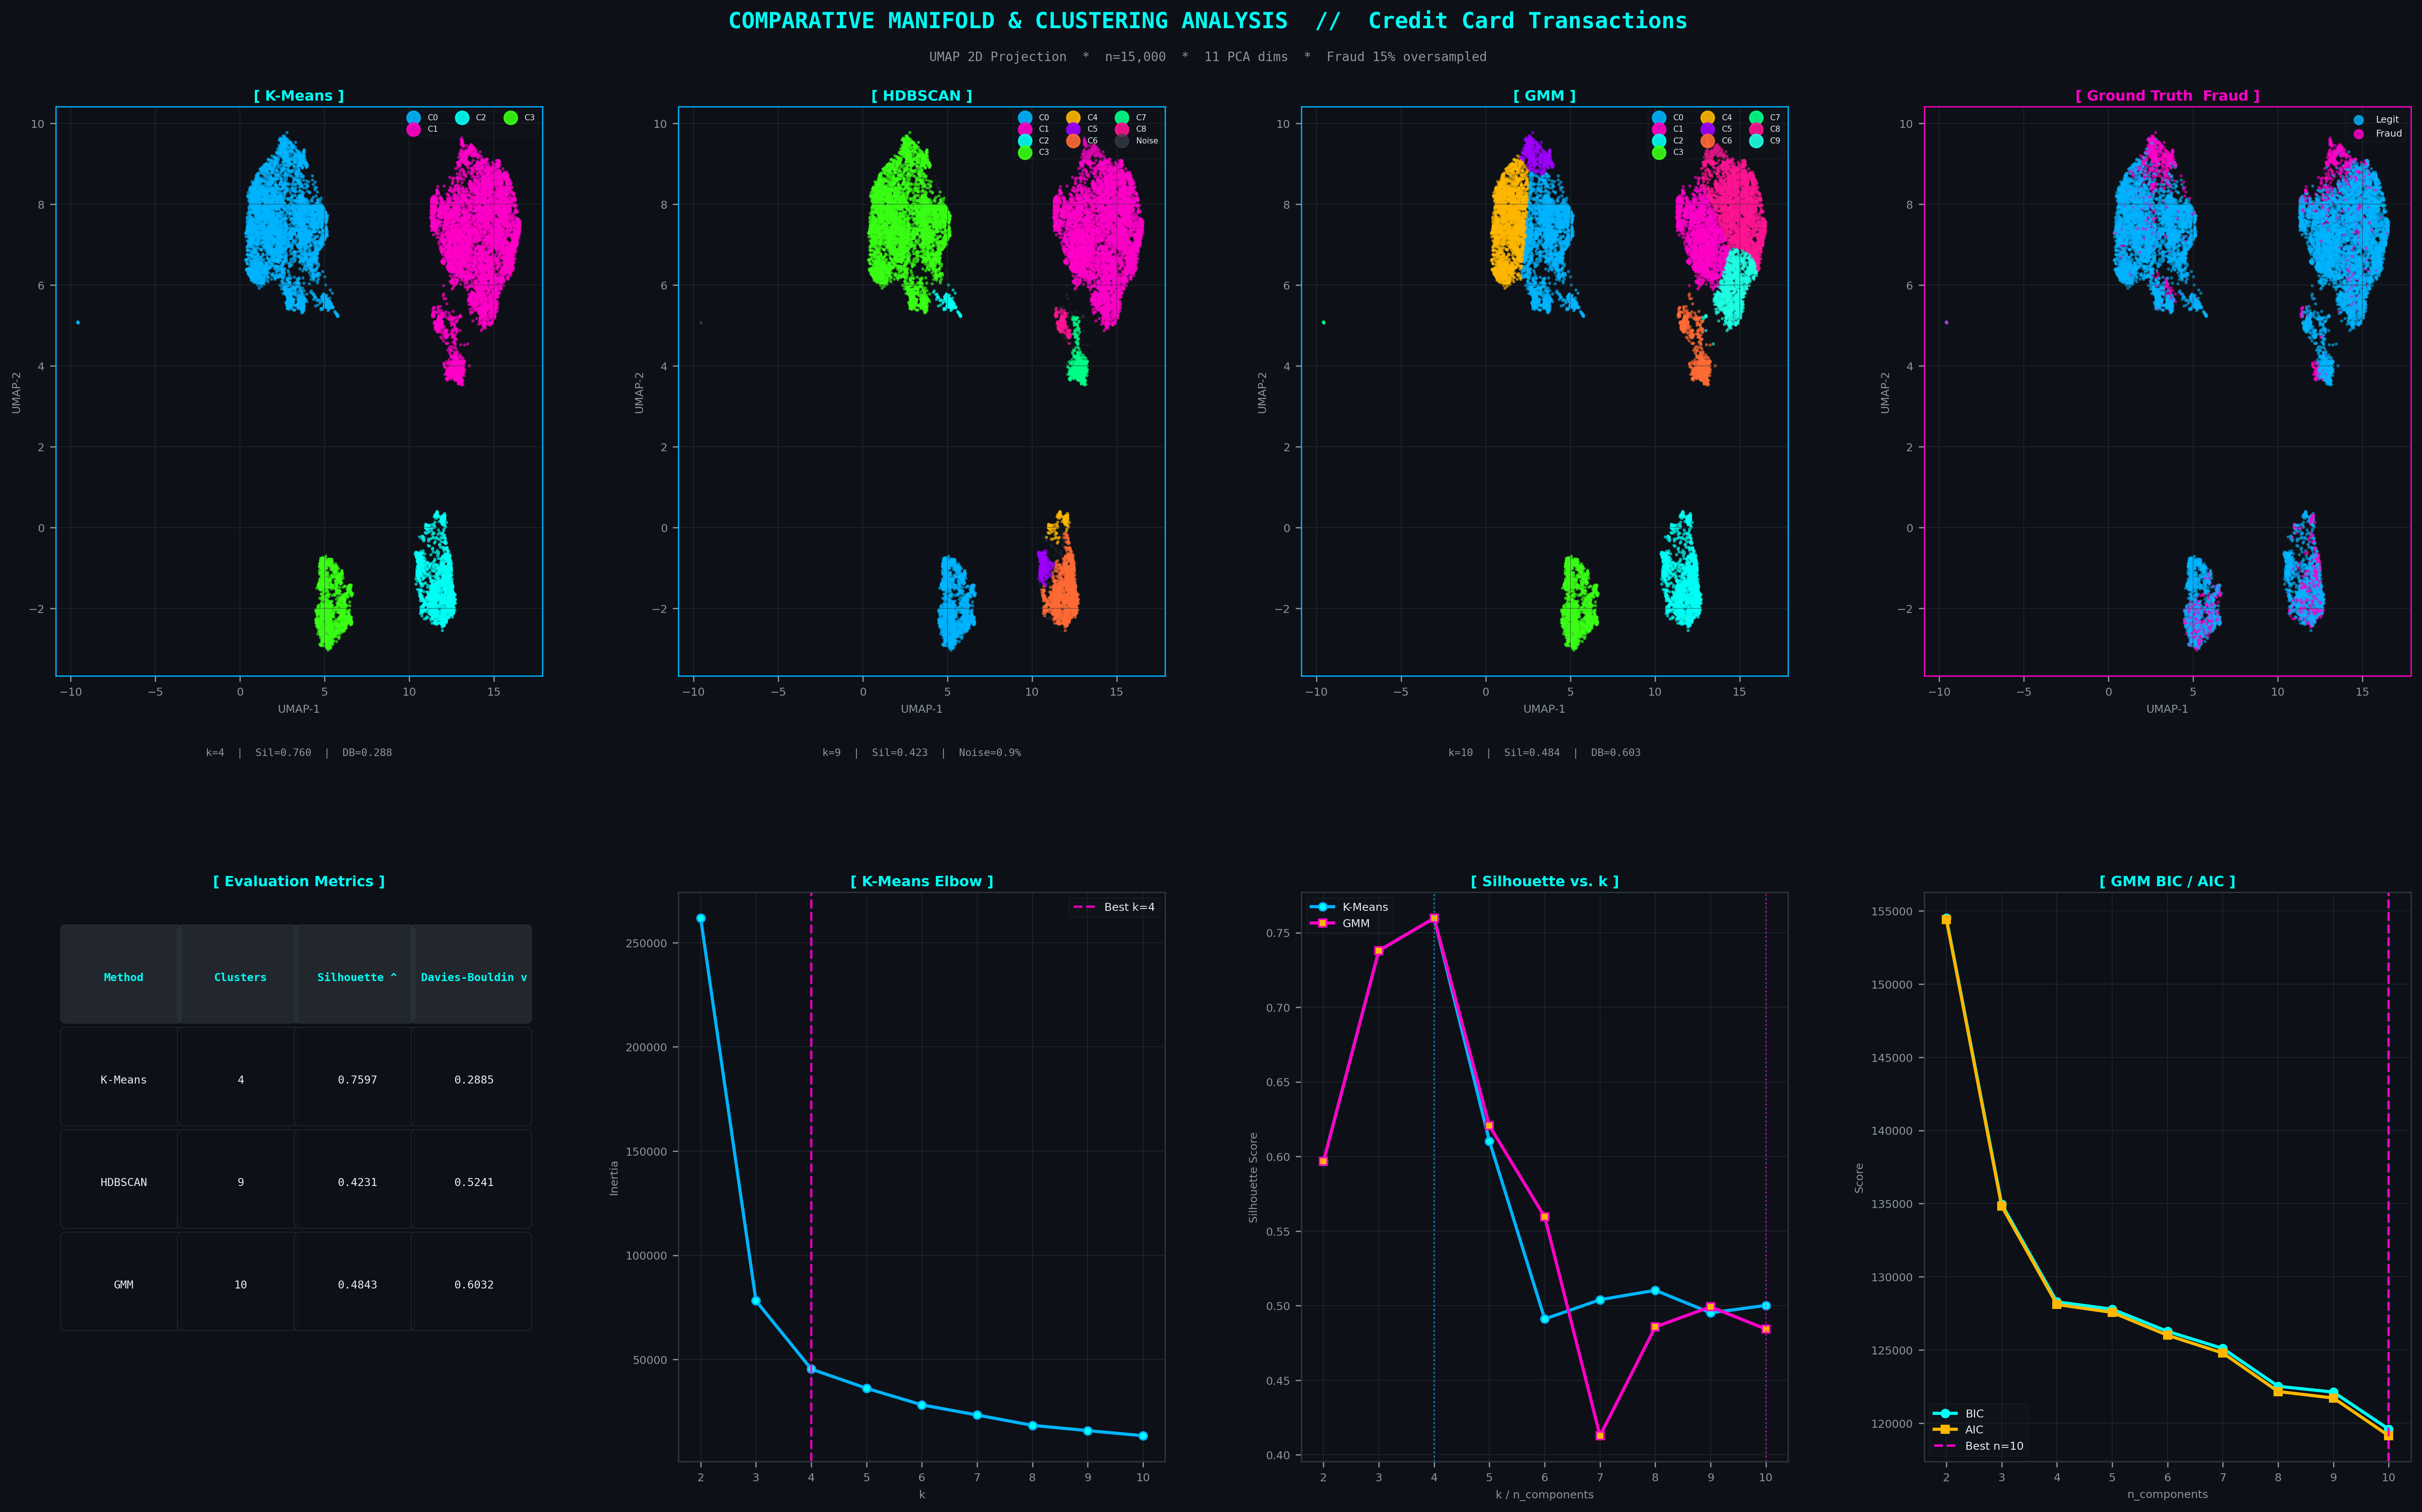
Master 2-row grid: 2D UMAP projections coloured by each method alongside ground-truth fraud overlay (top), and model selection diagnostics including elbow curve, silhouette comparison, and GMM BIC/AIC curve (bottom).
Three Philosophies
Each algorithm encodes a different belief about what a cluster is. The fraud topology demands one.
K-Means
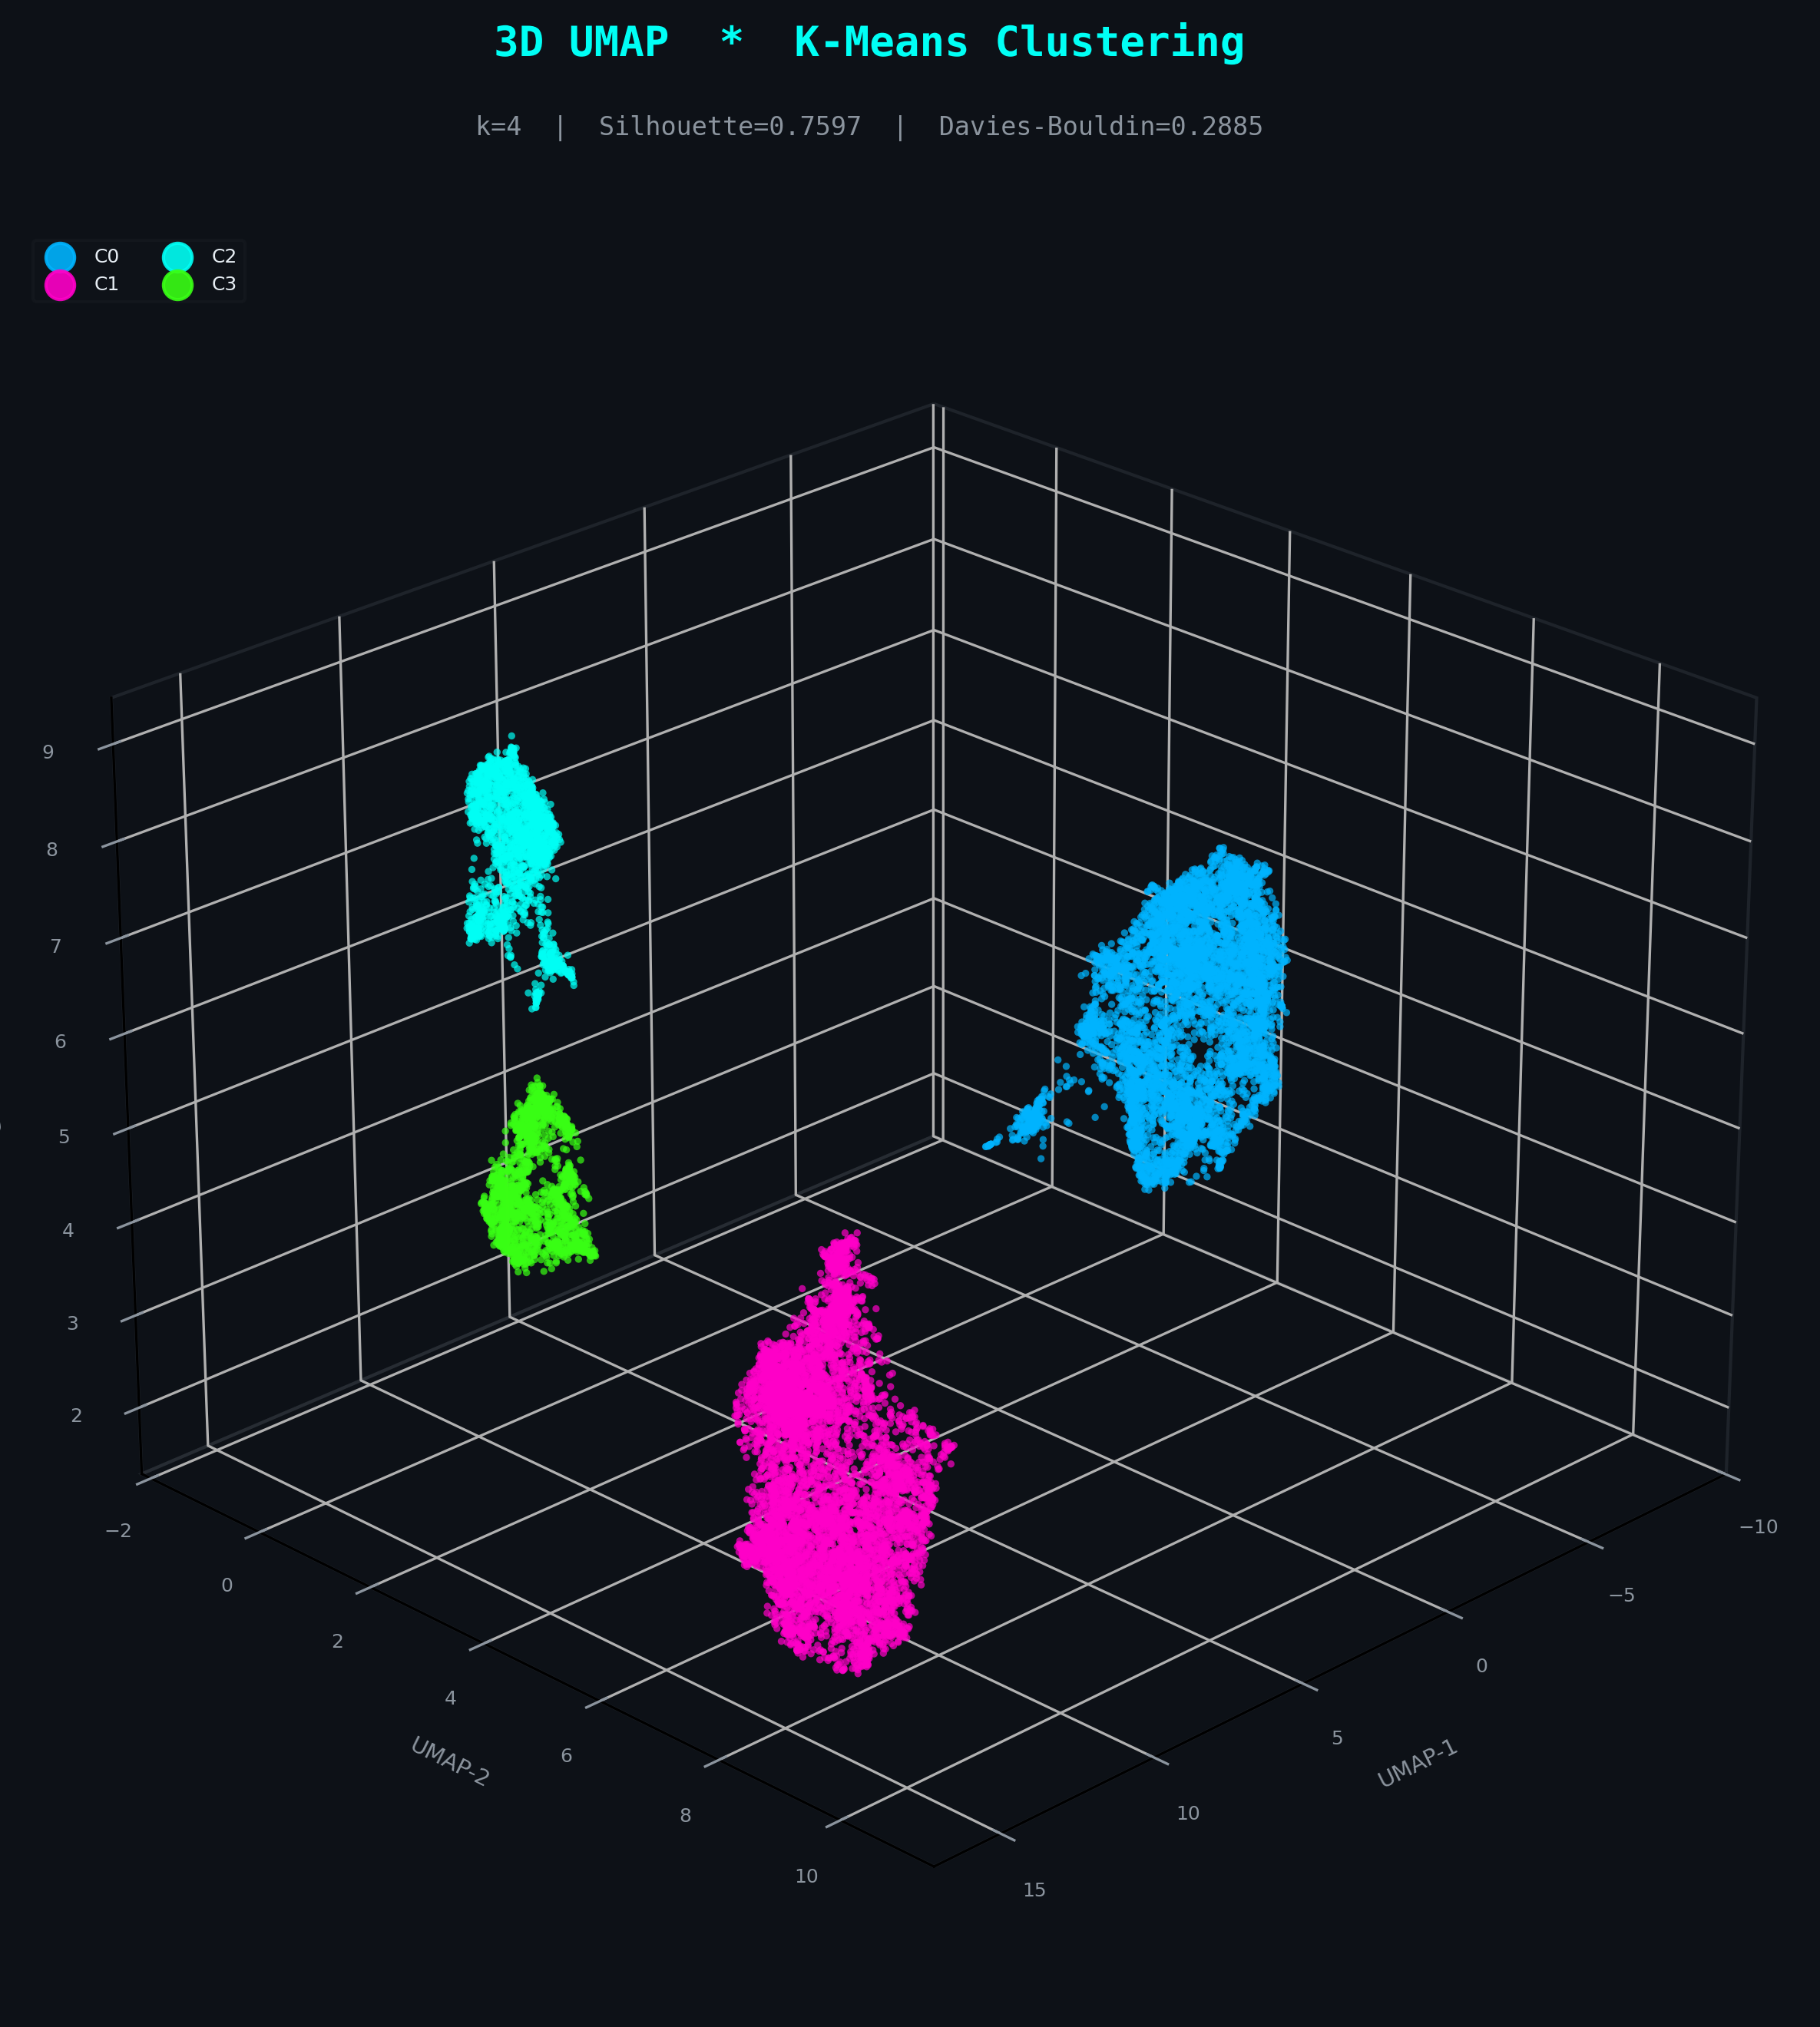
k = 4 clustersHighest geometric separation (Silhouette 0.7597) due to its assumption of spherical, equally-sized clusters. Excellent at partitioning the dense core manifold but blind to non-convex fraud tendrils and outlier topology — it assigns noise to the nearest centroid rather than flagging it.
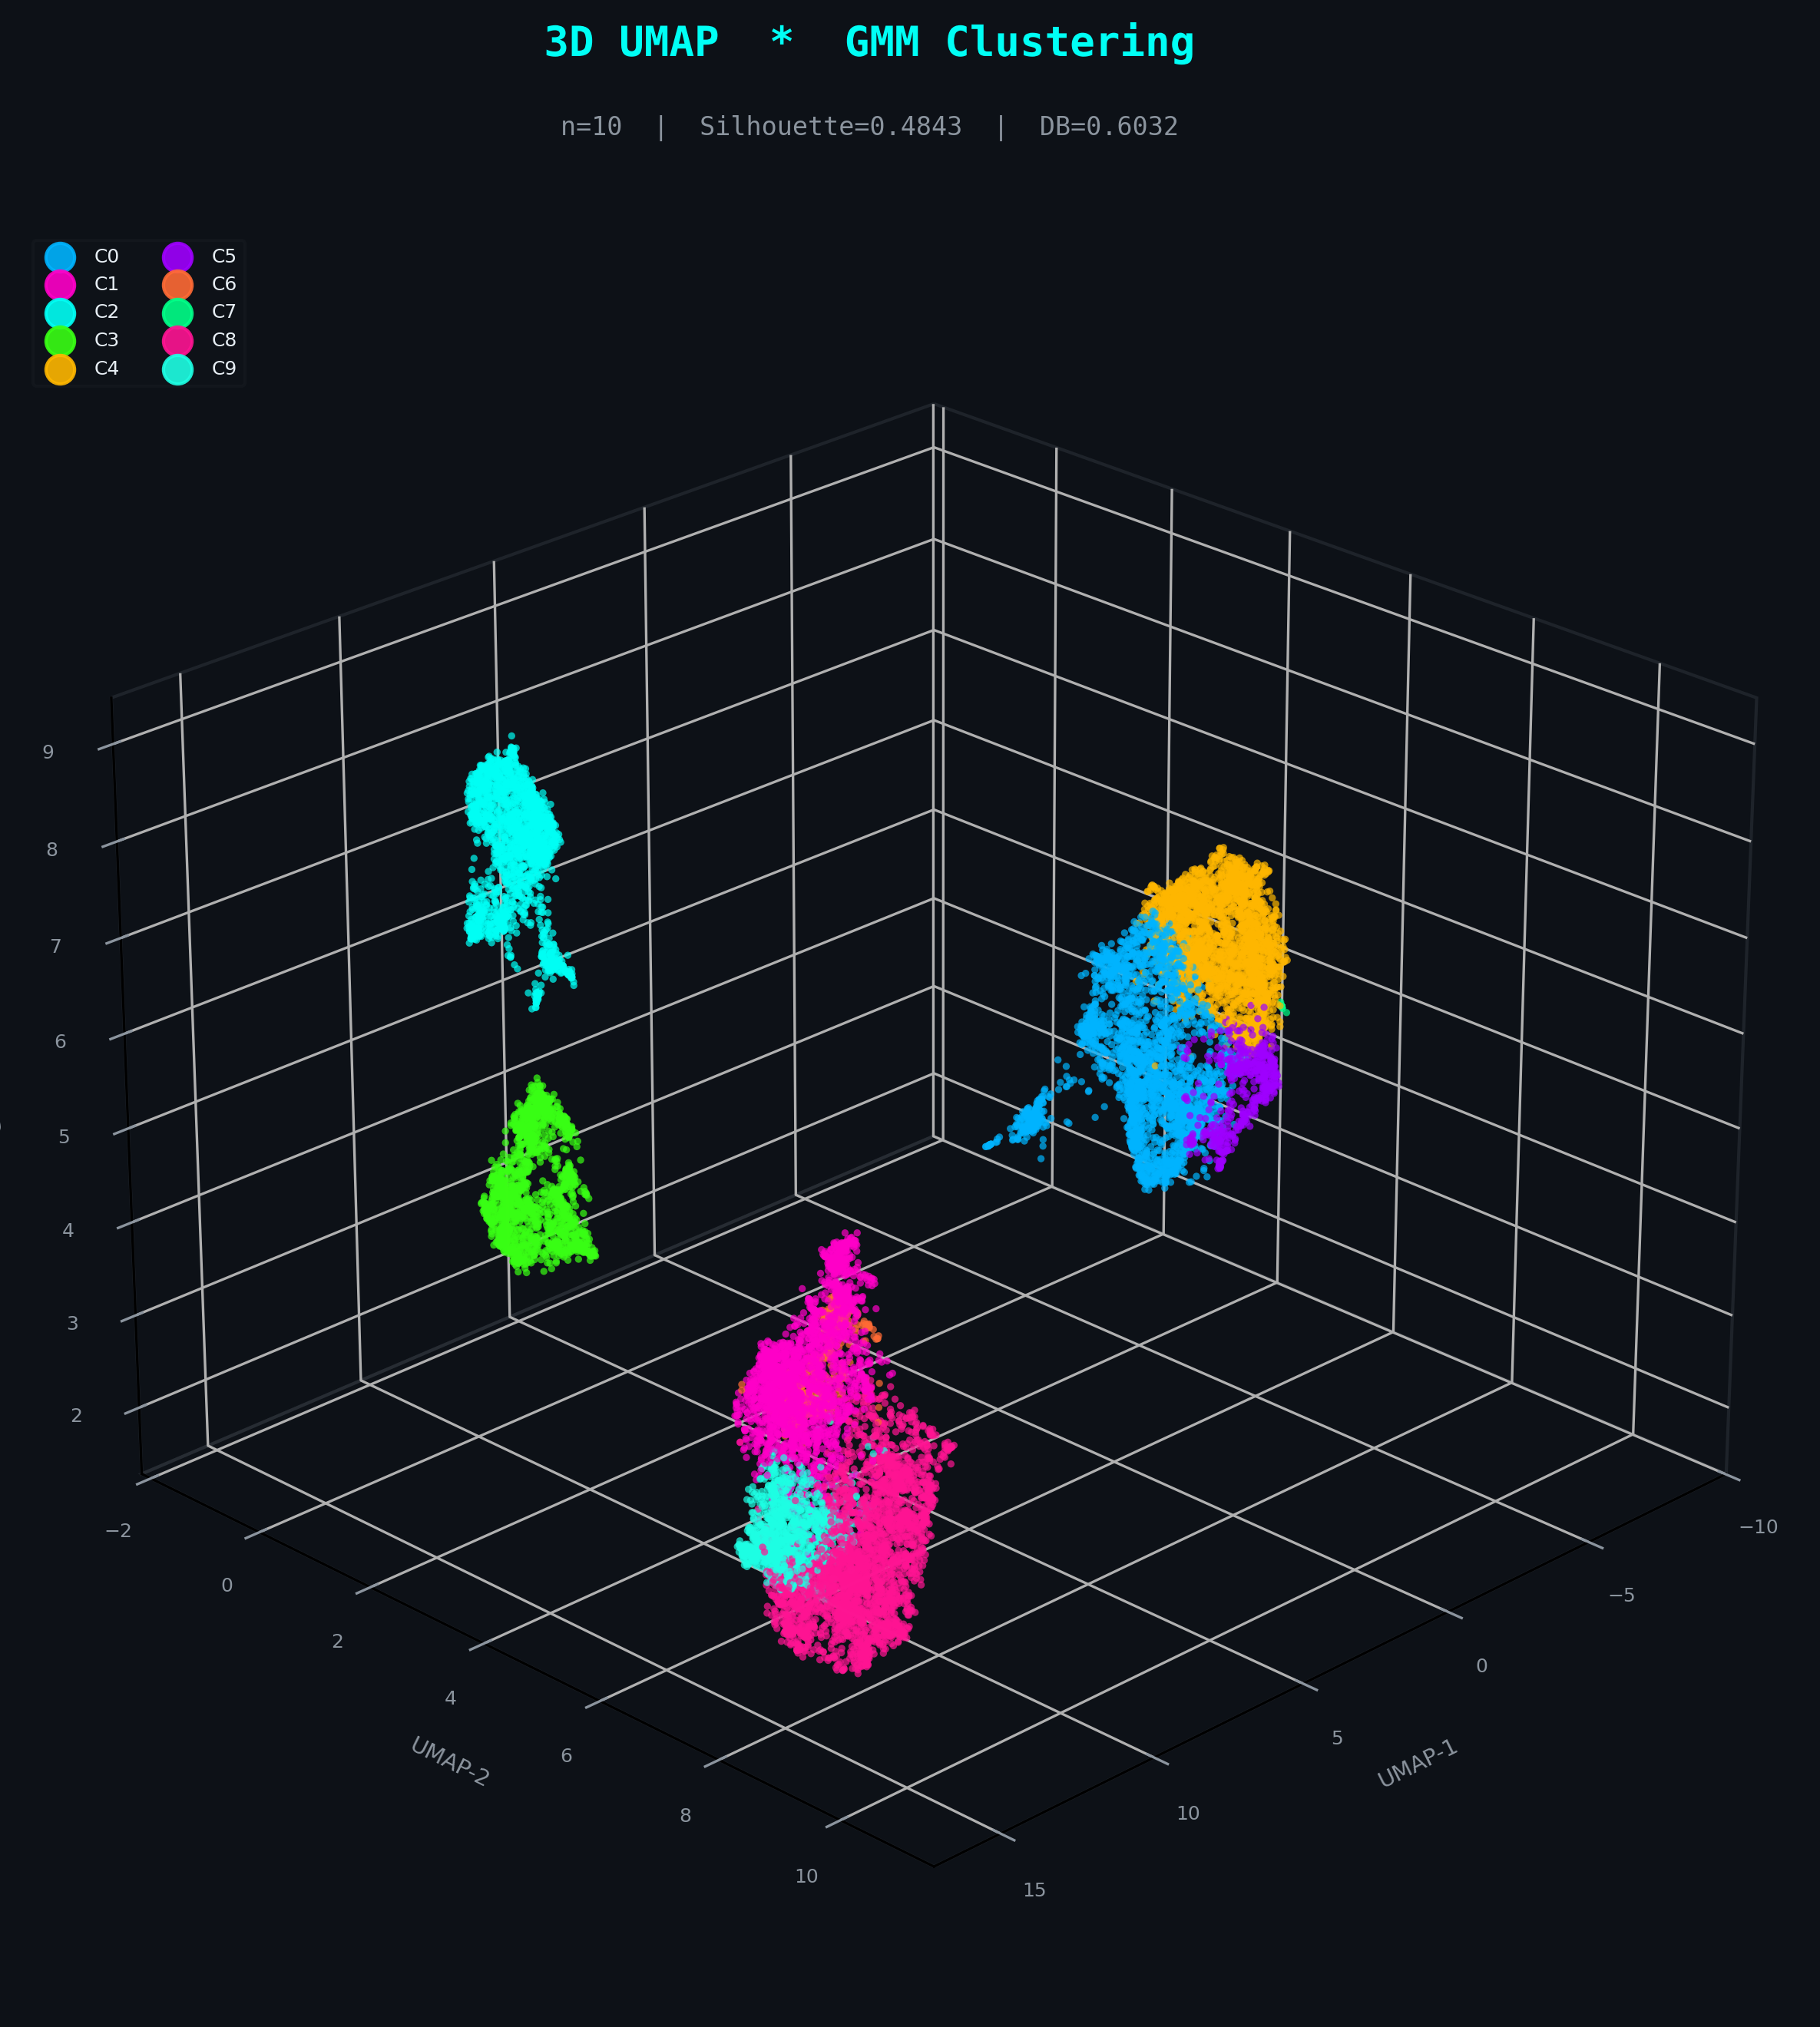
GMM
n = 10 componentsGaussian Mixture Models add soft, probabilistic assignments and allow ellipsoidal cluster shapes. BIC/AIC selection converged at n=10 components — capturing more latent structure than K-Means but still constrained to parametric Gaussian geometry. Fraud boundaries remain probabilistically blurred, not topologically isolated.
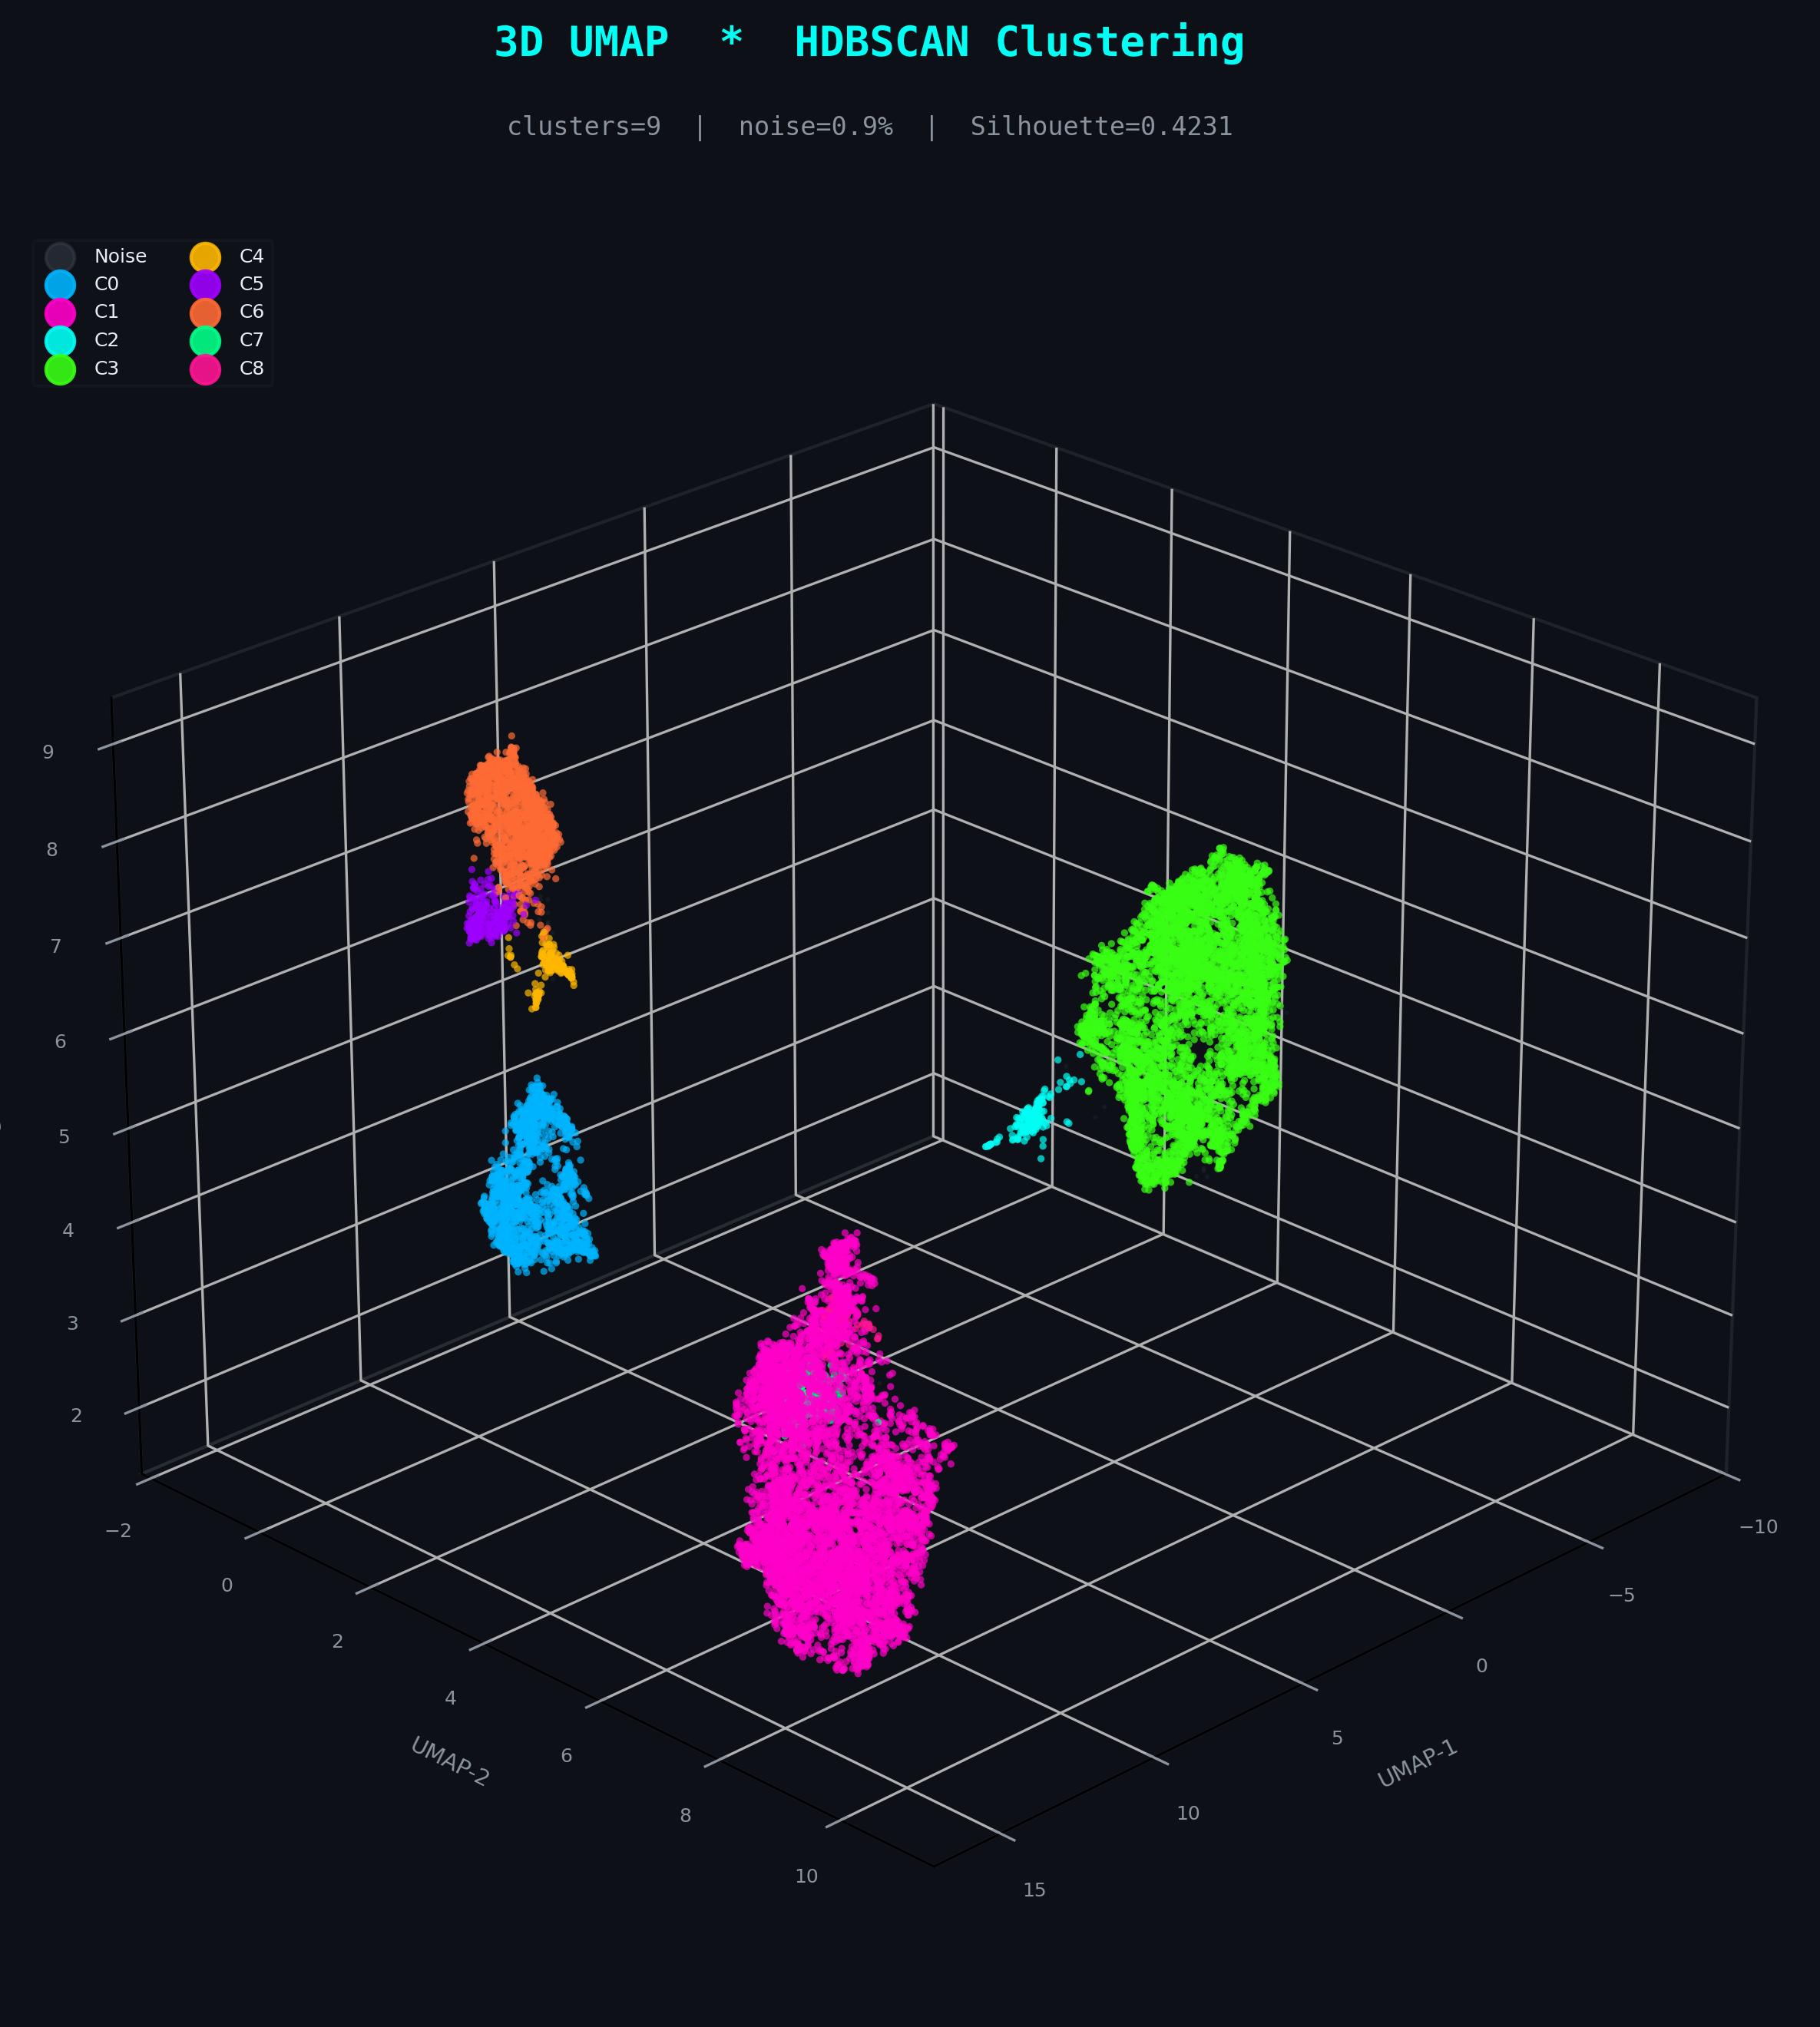
HDBSCAN
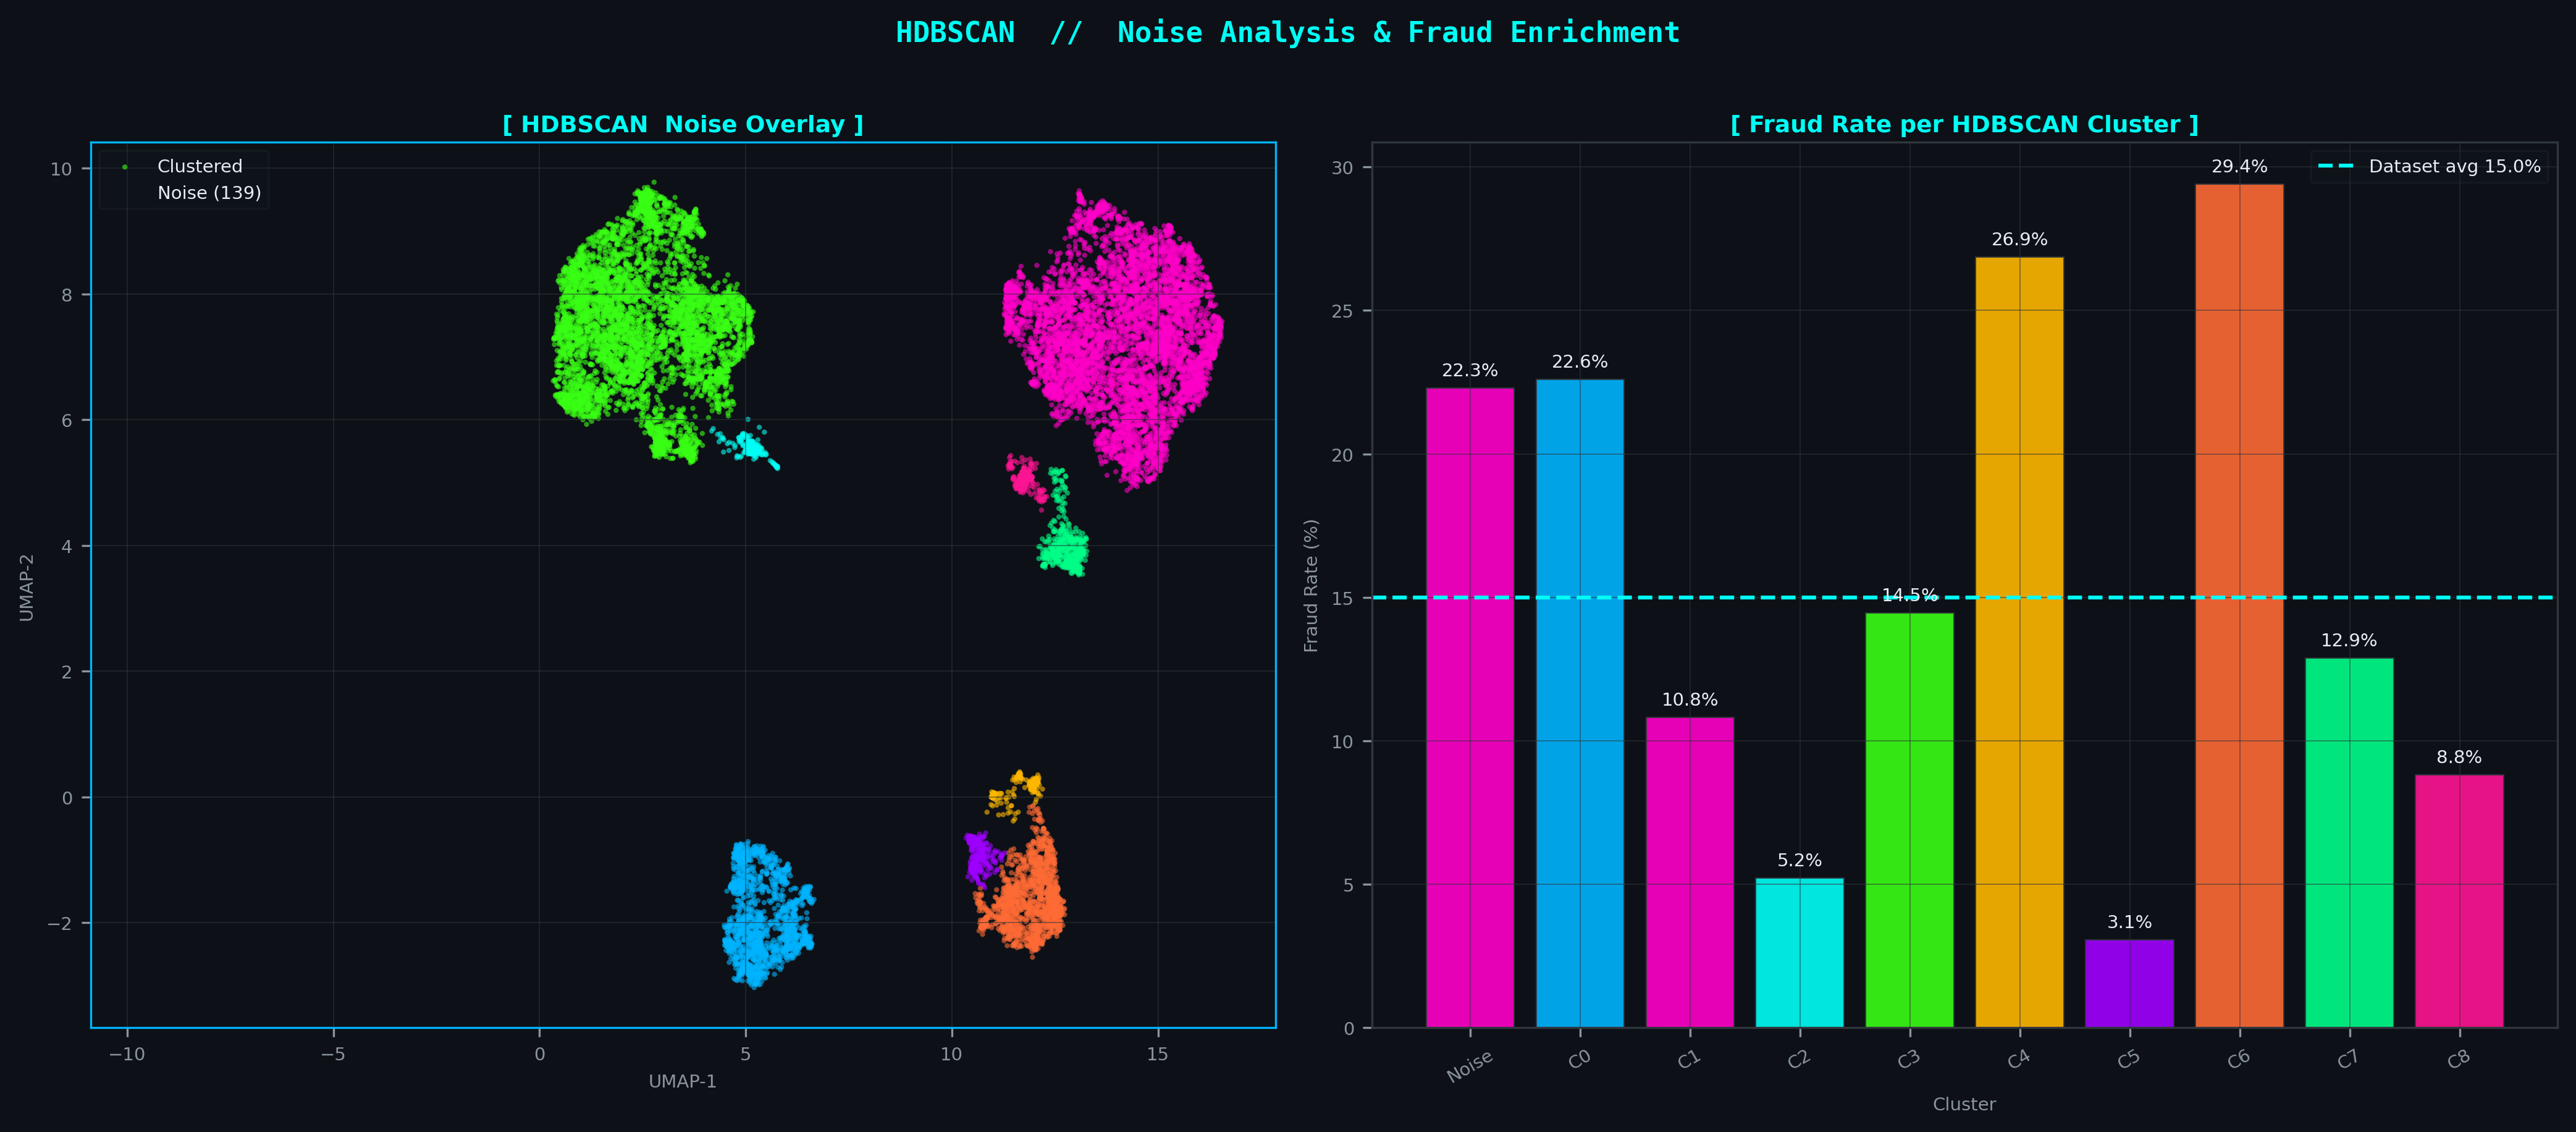
9 clusters + noise isolationDensity-based hierarchical clustering requires no assumption about cluster shape or count. It naturally discovers the irregular, filamentary topology of fraud transaction manifolds, explicitly labels low-density noise (0.9% of points) as outliers rather than assigning them, and produces a fraud enrichment hierarchy directly aligned with the UMAP embedding structure.
Local vs. Global Structure
UMAP constructs a weighted k-nearest-neighbour graph in the original 28-dimensional space, then optimizes a low-dimensional embedding to preserve that graph's topological structure. The n_neighbors parameter controls the local-to-global tradeoff: small values reveal fine-grained manifold structure; larger values preserve macro-topology. At n_neighbors=15, the embedding resolves both the dense legitimate transaction core and the sparse, filamentary fraud periphery simultaneously.
The 3D projection retains sufficient degrees of freedom to avoid the false separation artefacts that appear in 2D — critical when fraud clusters span multiple topological sheets.
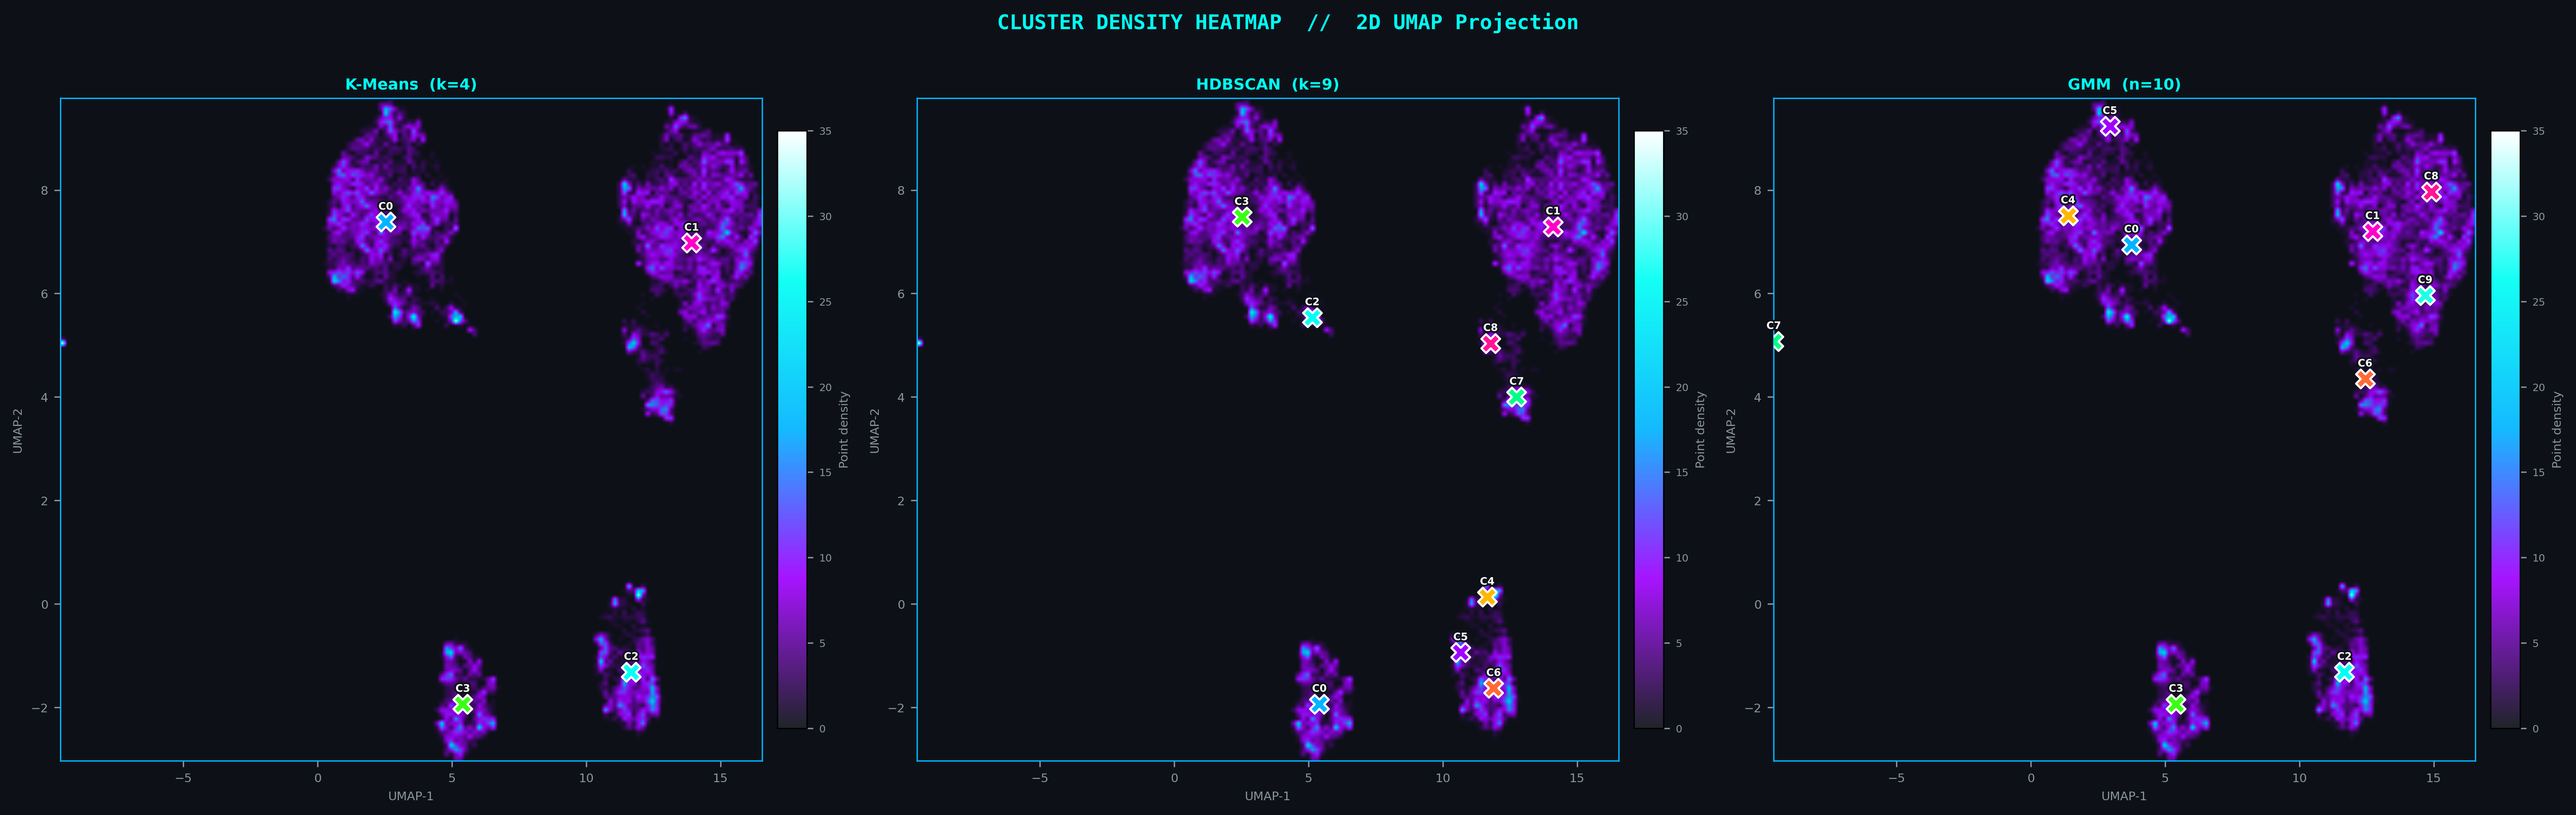
Density Heatmaps with Centroid Overlay — All Three Methods
Performance Matrix
| Method | Clusters | Silhouette ↑ | Davies-Bouldin ↓ | Verdict |
|---|---|---|---|---|
| K-Means | 4 | 0.7597 | 0.2885 | Geometric Baseline |
| GMM | 10 | 0.4843 | 0.6032 | Probabilistic |
| HDBSCAN | 9 | 0.4231 | 0.5241 | ★ Selected |
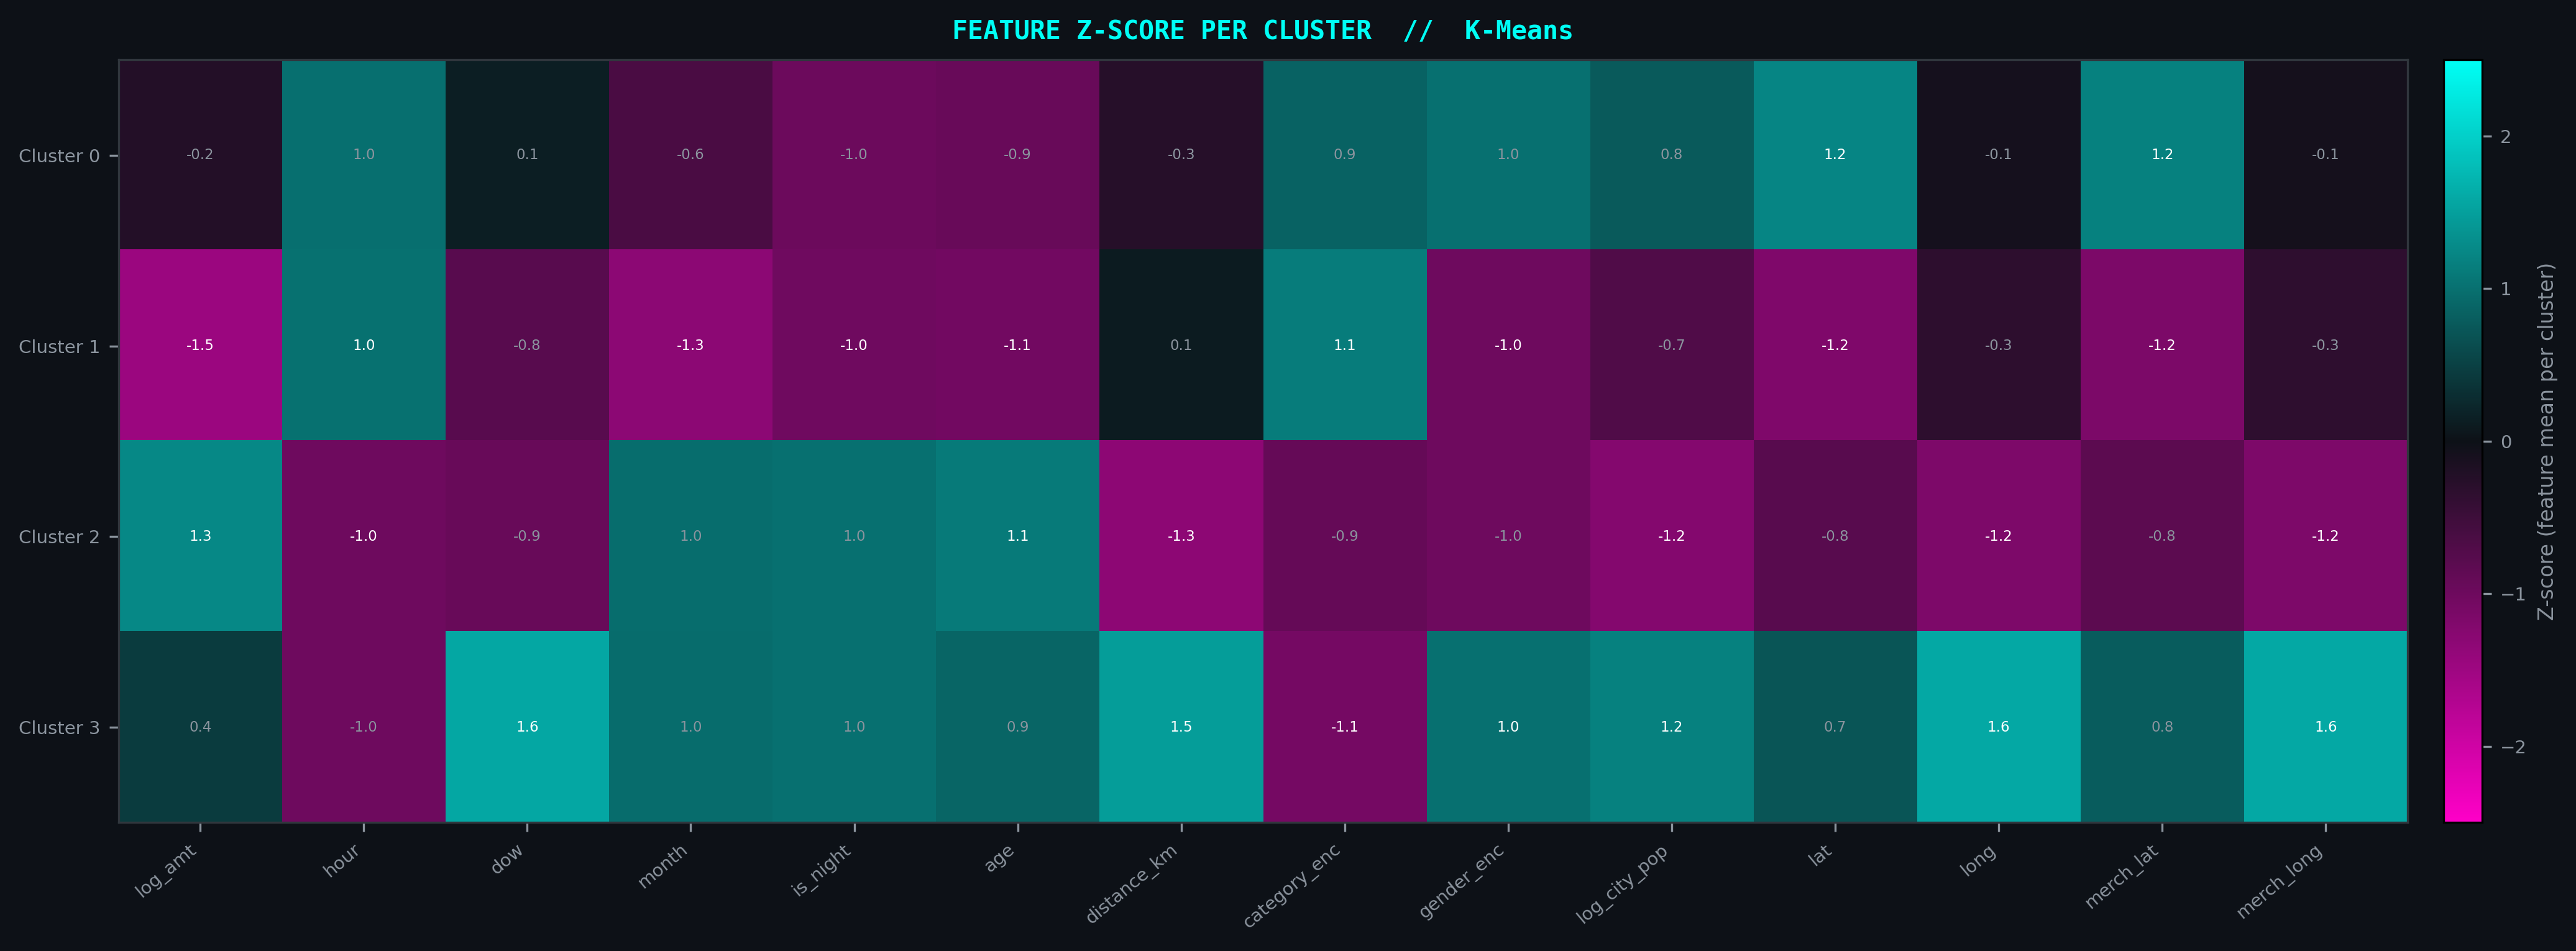
Z-Score Feature Importance · Clusters × 14 Features
What Defines a Fraud Cluster?
The diverging Magenta↔Cyan Z-score heatmap maps each of the 14 PCA-derived features against all discovered clusters. High-magnitude deviation in the Magenta direction (negative Z) signals anomalously low feature values — the fingerprint of suppressed legitimate transaction patterns that define the fraudulent topology.
Clusters with strong, multi-feature signatures are candidates for targeted fraud rules; sparse signatures indicate ambiguous boundary regions requiring probabilistic scoring.
Noise as Signal
In density-based clustering, points rejected as noise are not errors — they are topologically isolated. The two-panel analysis below shows exactly where HDBSCAN noise points sit in the 2D UMAP projection (Magenta) and how each cluster's fraud enrichment rate compares. The highest-enrichment clusters directly correspond to the manifold's low-density periphery.